Burlington's best car insurance rates
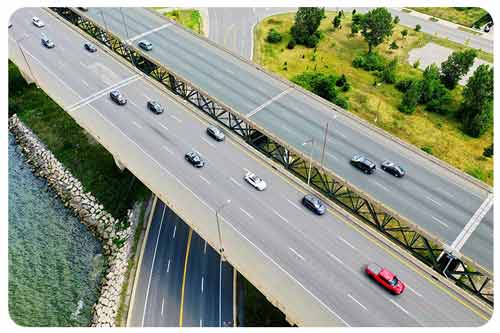
Burlington is known for its beautiful waterfront along Lake Ontario, but also for traffic, collisions on the QEW, and, unfortunately, higher car insurance rates. So, keeping auto insurance rates down is a priority for Burlington residents.
At ThinkInsure, we are a great option for Burlington drivers to save on auto insurance without sacrificing coverage. Whether you want to shop for quotes, look for new ways to save, or ask questions about coverage, we can help.
With partnerships with the top insurance companies in Canada, we’re confident we can help drivers in Burlington find cheaper car insurance. Get started by comparing quotes online or speak with one of our advisors. We'll help you get personalized coverage designed just for you and help you search for Burlington's most affordable auto insurance rates.
Key takeaways about Burlington car insurance
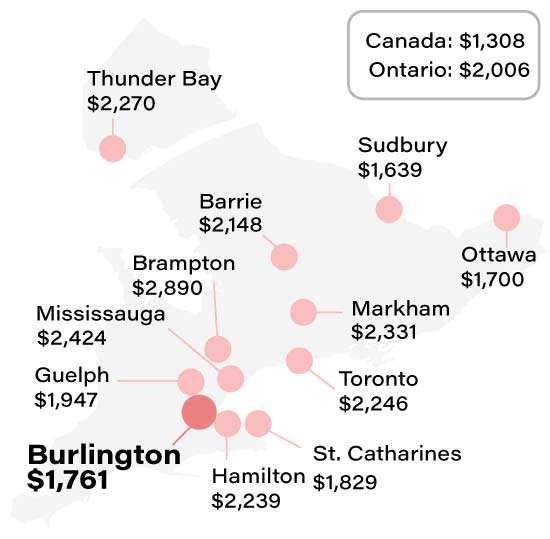
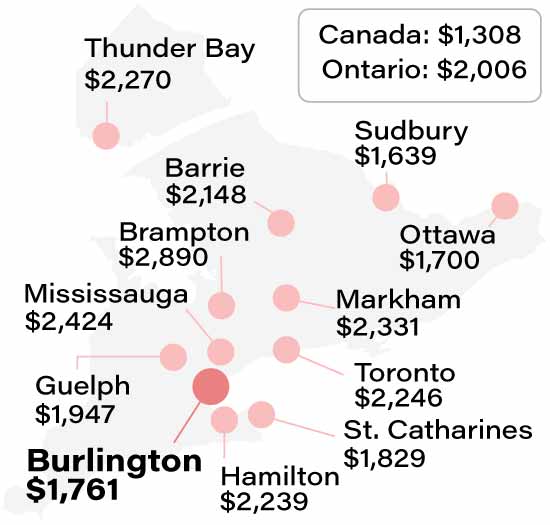
- Burlington car insurance premiums in 2025 are $1,761.
- Rates have decreased by 1.2% for some drivers since last year.
- Car insurance premiums in Burlington are more than $250 lower than the provincial average.